
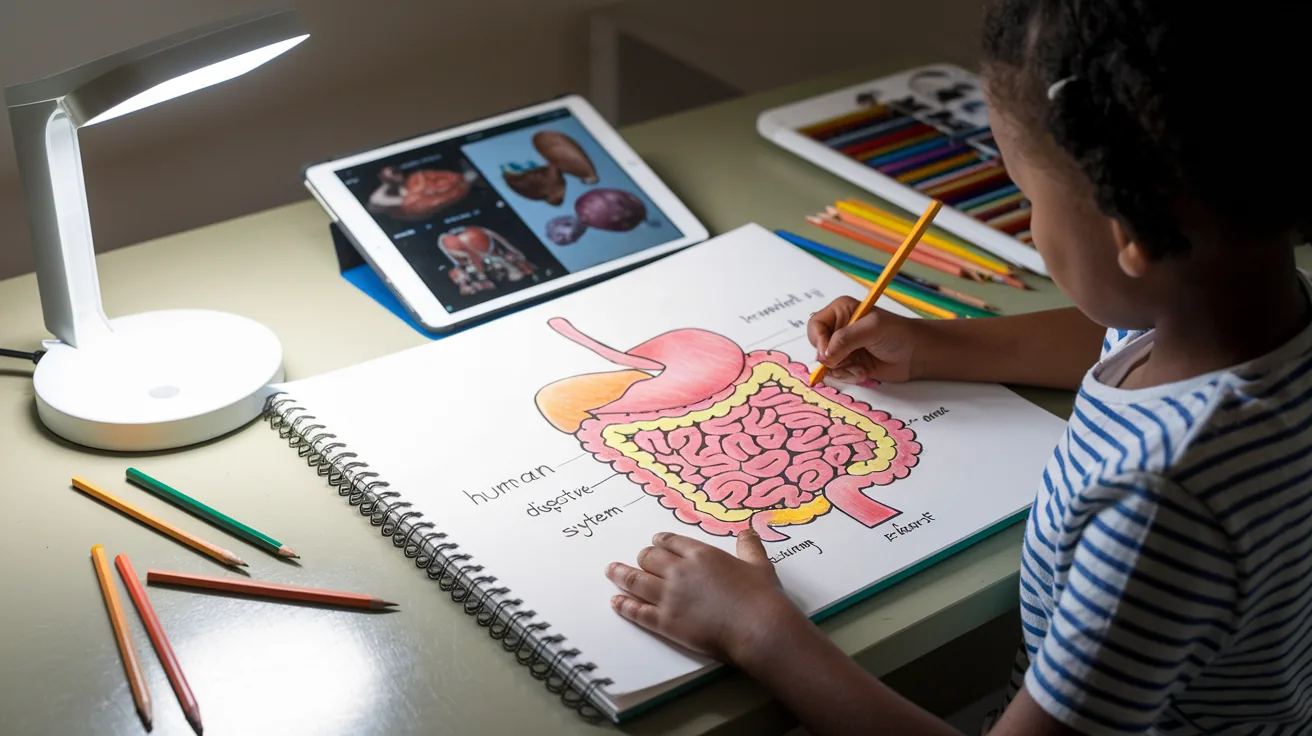
Ask a child to explain how the digestive system works after reading a textbook paragraph, and you'll likely get a vague recitation of isolated facts: "Food goes down a tube... there's acid in your stomach... something about intestines." Show that same child a clear diagram with arrows showing the path of food from mouth to stomach to intestines, with labels explaining what happens at each stage, and suddenly the system makes sense.
Yet many children still learn science mainly through reading, listening and text-heavy worksheets. This article explains why a good diagram helps, which kinds of diagram suit which Key Stage 2 topics, and how to use drawing at home.
The Science Behind Visual Learning
Educational psychologist Richard Mayer's cognitive theory of multimedia learning explains why diagrams help. When we learn from words alone, we're processing information through a single channel — the verbal/auditory channel. This channel has limited capacity and can become overloaded when concepts are complex or unfamiliar.
When we add relevant visuals to verbal explanations, we engage both the verbal channel and the visual/pictorial channel. These two channels can process more information at the same time, and they reinforce each other. The brain builds connections between the verbal representation ("roots absorb water from soil") and the visual representation (diagram showing roots underground with arrows indicating water absorption), creating stronger, more accessible memories.
Working Memory and Visual Efficiency
Working memory, the mental workspace where we actively process information, can hold only a handful of items at once. When a child tries to understand a complex process from text alone, each sentence must be processed sequentially, held in working memory, and integrated with previous sentences. This is cognitively demanding and prone to overload.
A well-designed diagram presents multiple pieces of information simultaneously in a spatial arrangement that shows their relationships. The child can see the entire system at once, reducing working memory load and making relationships between components immediately apparent. The heart is connected to the lungs, which are connected to blood vessels (Year 6, circulatory system): this spatial layout conveys structure more efficiently than paragraphs of text describing the same connections.
Why Science Particularly Benefits from Visual Learning
While visual aids enhance learning across subjects, science education benefits especially strongly. This stems from the nature of scientific concepts:
Invisible Processes Made Visible
Many scientific phenomena are invisible to the naked eye or happen too slowly or quickly to observe directly. Evaporation (Year 4, states of matter), electricity in a circuit (Year 4), digestion (Year 4, animals including humans) and forces (Year 3 and Year 5): children cannot directly see these processes happening. A diagram can show what happens to water when it evaporates, or how a complete circuit lets a bulb light.
Complex Systems with Multiple Interacting Parts
Science frequently deals with systems: the water cycle (Year 4), food chains (Year 4), the human body. Understanding these means grasping the individual components and also how they interact. Diagrams excel at showing relationships, connections, and cycles in ways that linear text cannot match. A food chain diagram immediately shows who eats whom and how energy flows through an ecosystem in a way that a paragraph describing the same relationships struggles to convey as clearly.
Spatial and Structural Relationships Matter
The physical arrangement of parts often matters to how a system works. The heart's position relative to the lungs (Year 6), the order of components in a series circuit (Year 4), the structure of a plant with roots below ground and leaves above (Year 3): these spatial relationships are part of the function. Visual representations preserve these spatial relationships, while text descriptions force the reader to construct mental images from sequential descriptions.
Types of Visual Representations and Their Strengths
Different kinds of visual serve different purposes:
Labelled Diagrams
These show the parts of a structure or system with text labels. They are excellent for learning structure: the parts of a flower (Year 3), the components of a circuit (Year 4), the organs of the digestive system (Year 4). The spatial arrangement shows how parts relate physically, while labels provide technical vocabulary.
Process Diagrams with Arrows
These show how something changes over time or moves through a system. Arrows indicate direction, sequence, or causation. The water cycle (Year 4), digestion (Year 4) and how water moves up through a plant (Year 3) are all best understood through process diagrams.
Cutaway and Cross-Section Diagrams
These show what's inside an object or organism without needing to physically dissect it. Particularly valuable when the interesting parts are hidden: the layers of soil and cross-sections of different rocks (Year 3), or the inside of a seed (Year 3 and Year 5).
Comparison Diagrams
These place two or more related items side by side to highlight similarities and differences. Comparing herbivore and carnivore teeth (Year 4), solids, liquids and gases (Year 4), or the skeletons of different animals (Year 3) becomes clearer when the pictures sit side by side.
Time-Lapse Sequences
These show the same subject at different points in time, making slow changes visible. Plant growth from seed to adult plant (Year 3), the Moon's changing shape over a month (Year 5), or a butterfly's life cycle (Year 5) all benefit from a sequence of images.
The Difference Between Helpful and Distracting Visuals
Simply adding pictures to text does not guarantee better learning. Decorative images that are interesting but irrelevant to the learning goal are sometimes called "seductive details". They are different from instructional visuals, which directly support understanding.
A textbook page about the digestive system with a cartoon chef character waving from the corner might be more visually appealing, but that chef is a seductive detail. It catches attention but doesn't support understanding how digestion works. Worse, it consumes limited attention and working memory capacity without contributing to learning.
Effective instructional visuals share these characteristics:
- Directly relevant to the concept being taught: Every element serves a purpose in explaining the concept.
- Clear and uncluttered: Complex diagrams can be overwhelming. The best visuals show only what's needed for the current learning goal.
- Integrated with text: Labels, captions, and arrows connect verbal and visual information, explicitly guiding attention to key features.
- Properly sequenced: For complex topics, breaking a single complex diagram into several simpler ones shown sequentially builds understanding more effectively than one overwhelming image.
How to Use Visual Learning at Home
Parents can use these ideas at home:
Draw It Together
When your child is struggling with a concept, suggest drawing it together. "Let's draw what happens to food in your body" often clarifies thinking better than re-reading text. The act of creating a visual representation forces the child to externalise their understanding, making gaps and misconceptions visible.
Do not worry about artistic quality; stick figures and simple shapes work perfectly. The point is the thinking process, not creating a masterpiece.
Seek Out Quality Visual Resources
YouTube has excellent science channels with animations showing processes that are difficult to observe directly. Channels like Crash Course Kids, SciShow Kids, and educational content from organisations like the BBC and National Geographic use high-quality animations to explain complex concepts.
The key is active viewing rather than passive consumption. Pause videos to discuss what you're seeing. Ask your child to predict what will happen next in a process. Have them explain in their own words what the animation just showed.
Use Real-World Observations
Visual learning isn't limited to diagrams and screens. Direct observation is the most powerful visual learning of all. Growing a bean plant lets your child see root growth, leaf development and flowering in sequence. Watching ice melt and water evaporate makes state changes tangible. If you live somewhere hot, such as Dubai or Singapore, a glass of iced water left on the table shows condensation forming on the outside within minutes (Year 4, states of matter).
Follow up observations with drawing or photography. "Let's draw what the bean plant looked like last week and what it looks like now" creates a visual record that makes change over time visible.
Create Concept Maps and Mind Maps
These are visual ways of organising information, showing how concepts connect. For a topic like "food chains," your child might create a map with the sun in the centre, arrows showing energy flowing to plants, then to herbivores, then to carnivores, with labels explaining each connection.
The spatial arrangement and connecting lines externalise relationships that would otherwise remain abstract.
Visual Learning and Different Learners
Diagrams help every child, not a special category of child. Some groups benefit even more:
Struggling readers: Children who find decoding text difficult can reach science concepts through diagrams and illustrations that they cannot reach in text-heavy materials. This prevents reading difficulties from masking science aptitude.
Children with working memory challenges: Visual representations reduce working memory demands by presenting information spatially rather than sequentially, helping children who struggle to hold multiple pieces of information in mind simultaneously.
English language learners: Well-labelled diagrams support vocabulary development and concept understanding even when language proficiency is still developing. The visual shows what the word means in a direct, concrete way.
Fareed is an AI science tutor for the British primary curriculum; it is currently on a waitlist.
Practical Implications for Parents
Prioritise visual resources: When choosing supplementary materials, favour those with clear, instructional diagrams over text-heavy resources. A well-illustrated science book is worth far more than a wordy one with occasional decorative pictures.
Encourage drawing and diagram creation: Make drawing a routine part of studying science. "Can you draw me what happens to food in your body?" is often more revealing than "Can you tell me about digestion?"
Watch for visual misconceptions: Sometimes children's drawings reveal misunderstandings that don't show up in their verbal explanations. A child who draws the brain in their chest, or draws a circuit with a gap in it and expects the bulb to light, needs targeted correction.
Use visuals to scaffold difficult text: When textbooks are unavoidably text-heavy, work through difficult paragraphs by sketching what they describe. This transforms passive reading into active sense-making.